Work / 002 IN BETA
Smart Pour Spout
Passive, per-pour liquor inventory for bars, invisible to the bartender, unmissable to the ledger.
- pour-detection accuracy, v6
- prototype iterations
- reduction in tracked inventory loss
- poured per charge
Sequence · one pour, fully witnessed
- A The bottle lifts and tips. The IMU has already decided: this is a pour, not a shake, not a carry across the room.
- B Liquid crosses the flow sensor. Every millilitre is counted while it's still in the air.
- C Bottle up. Event logged: 45.0 ml, 99.4% confidence. The ledger knew before the glass hit the rail.
01 · Problem
Bars lose 15–25% of liquor inventory to overpouring, wastage, and pilferage, and the standard countermeasure is a monthly manual audit that tells you what vanished, never when or how. Existing fixes (POS reconciliation, scales, camera AI, RFID) either interrupt service or measure too coarsely to act on.
The constraint that shaped everything: the bartender’s workflow could not change. A measurement system that slows a Friday-night pour is a measurement system that gets removed.
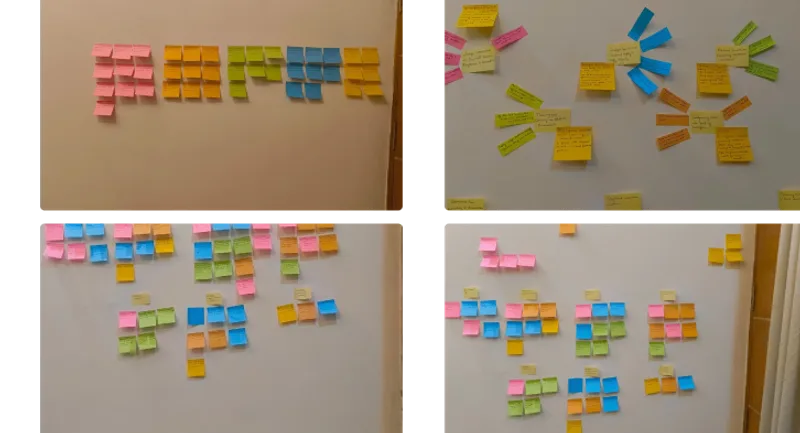
02 · Research
Before designing hardware we spent 50 hours in ethnographic observation across 8 bars, mapping how spouts are actually handled: the flips, the taps, the half-pours, the bottle swaps. We benchmarked five competing approaches and journey-mapped three roles: bartender, floor manager, accountant. The pour spout won as the only intervention point that touches every pour without touching the workflow.
03 · Engineering
The device is a pour spout with an integrated flow sensor, later fused with a 6-axis IMU so the system knows the difference between a pour, a shake, and a bottle being carried across the room. Pour events stream to an audit layer that flags variance in real time instead of at month-end.
Power had to be a non-event for staff: the spout pours 10 liters per charge and drops onto a magnetic charger at close.
| Rev | Detection accuracy | What changed |
|---|---|---|
| v1 | 84% | Flow sensing proven on continuous pours |
| v2–v4 | 88–95% | Flow path redesign; event segmentation |
| v5 | 98% | IMU added: orientation-aware pour detection |
| v6 | 99.4% | Fusion tuning under real bar-rail abuse |
04 · Outcome
In development testing at a single bar station, the system validated a ~20% reduction in inventory-related losses, overpouring included.
EXHIBIT A · THE SPOUT IN USE · LIVE POURS
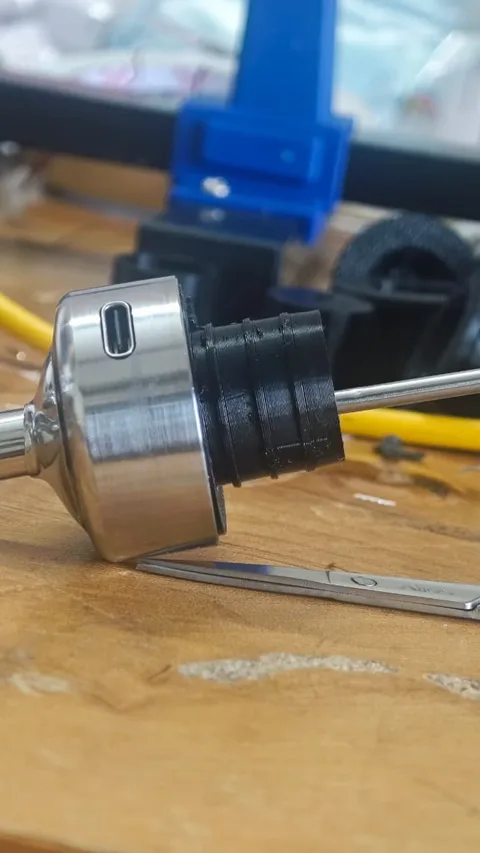
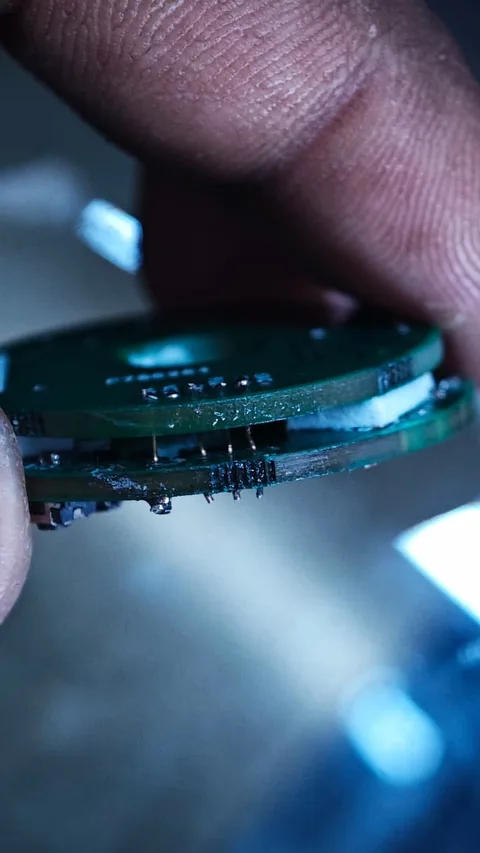
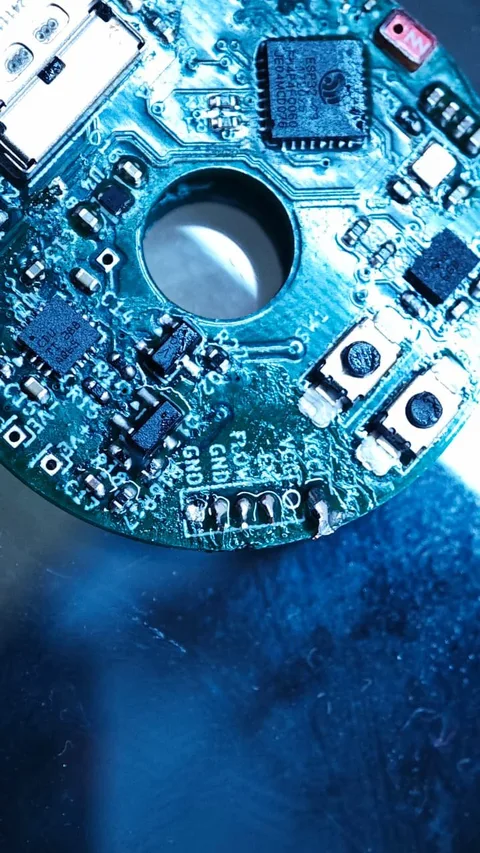
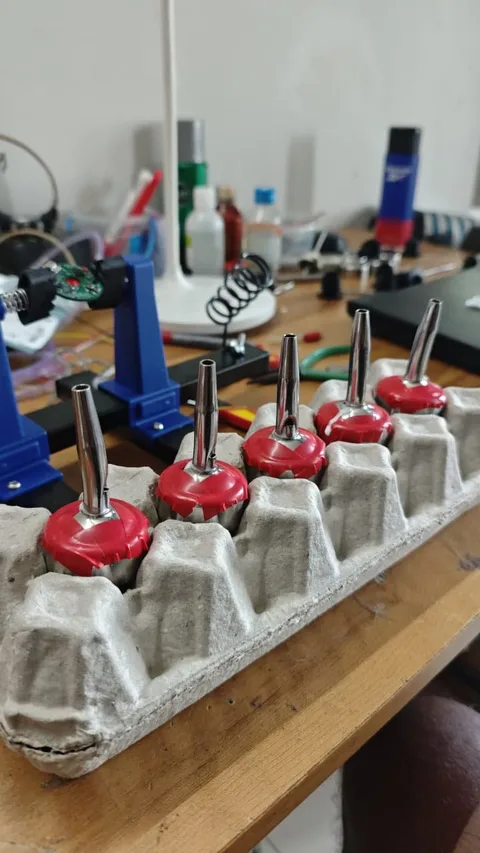
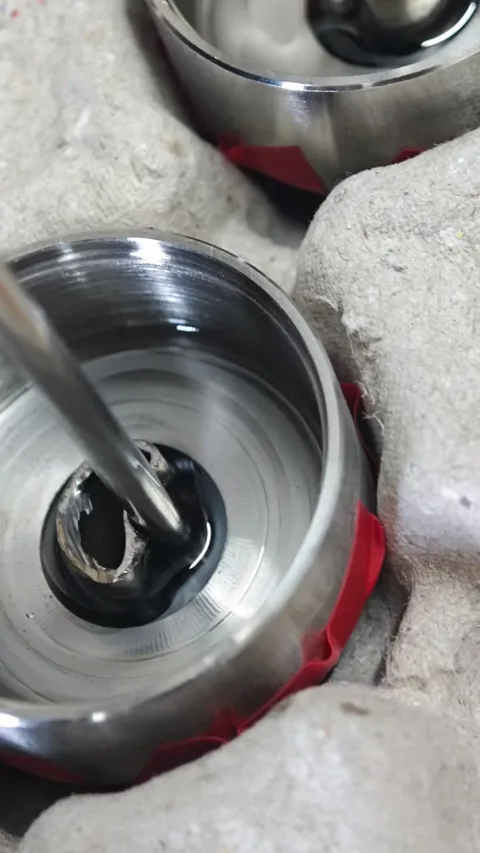
EXHIBIT B · FIELD TESTING ACROSS BAR STATIONS
The deeper result is the one the industry hasn’t had: a per-pour ground truth. Once every pour is a data point, shrinkage stops being a write-off and becomes an engineering problem.